

IMF’s Map of a Broken World has one Exception - India’s Growth and Resilience
India's contribution to the improved global growth outlook extends well beyond the immediate AI boom or the performance of energy-exporting economies. The IMF's assessment points instead to a combination of domestic demand, demographics, market expansion and structural reforms as important drivers of India's longer-term prospects.
 Oct 23, 2026

Economics is one subject where objective prediction is perhaps impossible. If it were otherwise, the world might not have experienced so many economic downturns, recessions and depressions.
For most people, the economy is reflected at the dining table - and rightly so. The cost of food, household expenses, employment and the purchasing power of their income are what matter in everyday life. Yet, beyond the dining table lies a vast economic ecosystem, constantly endeavouring to sustain growth, create opportunities, and make life better for people at large.
The media, particularly social media, is full of economists and experts analysing the present state of the economy and predicting its future. The IMF, for its part, publishes its World Economic Outlook report twice a year.
Its latest report, published on 16 October 2026, has drawn my attention to its projections for India and the country's positive economic prospects over the coming decade. I was curious, as I am sure many of you would be, about what might lie behind these assessments.
I studied the report and found some interesting points tucked away in its analysis - factors that may help explain the IMF's assessment of India's economic prospects.
From the report
Global economic activity remains resilient, supported by the technology upturn, economic buffers and adaptations to geopolitical disruptions. The IMF, in its October – report, projects global growth of 3.1% this year and 3.4% next year. That may sound reassuring, but the IMF warns that these global averages conceal a world increasingly divided by two powerful forces: war and technology.
And one of the most revealing illustrations of this divide emerged in the oil market in the last week of March this year. As the war in the Middle East threatened to bring traffic through the Strait of Hormuz almost to a standstill, oil prices surged to $126 a barrel. But the headline price told only part of the story. The more revealing signal lay beneath it.
The world has two major crude oil benchmarks: Brent, which reflects oil prices in the Atlantic basin, and Dubai, which serves as a key benchmark for the Gulf crude that much of Asia imports.
Normally, the two move broadly in tandem, with a gap of just a few dollars. In March, however, that gap widened dramatically to $54 a barrel. This signalled that the supply shock was being felt most acutely in precisely the category of crude on which Asia depends.
Under these circumstances, one would expect a large Asian economy that imports most of its oil to be particularly vulnerable. Yet, when the International Monetary Fund released its latest forecasts this week, it raised India's growth projection by more than that of any other major emerging economy.
Let us read some highlights of the IMF report to tell a story about India that most of the headlines have actually missed
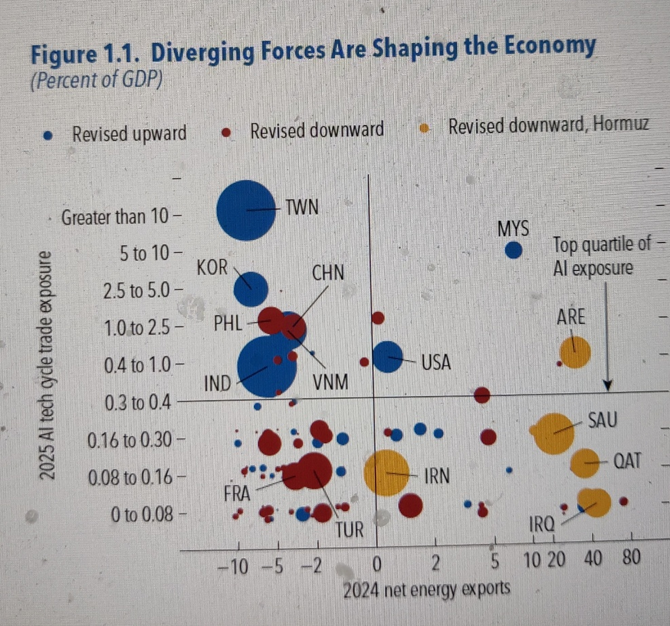
Understanding Figure 1
Figure 1 from the report is a basic graph divided into four quadrants.
The X-axis measures energy trade exposure. Countries on the right side of the vertical line export more oil, gas and coal than they import. They therefore stand to gain when energy prices rise. Saudi Arabia and Qatar are examples of energy-surplus countries in these quadrants.
Countries on the left, by contrast, import more energy than they export. Any disruption in energy markets or a sharp rise in prices can put considerable pressure on their economies.
The Y-axis measures how deeply a country's trade is connected to the artificial intelligence (AI) boom through chips, servers and computing equipment. The higher a country sits on this axis, the greater its exposure to the AI wave. Taiwan, at the very top, has an AI hardware trade balance worth more than a tenth of its entire economy.
The colours and sizes of the bubbles add another dimension to the graph. Blue bubbles represent countries whose growth forecasts the IMF has raised; red bubbles represent those whose forecasts it has lowered; and yellow bubbles represent countries whose forecasts have been cut because of the closure of the Strait of Hormuz. The size of each bubble indicates the magnitude of that country's contribution to the change in the global growth forecast.
According to the IMF's analysis, the most difficult position on this map is the bottom-left quadrant. Countries here import energy but have limited exposure to the AI boom. They pay more for oil and other energy supplies without gaining much from the technology-driven trade expansion.
Domestic Demand and India's Growth
India sits on the left because it is an energy importer. However, it lies above the horizontal line, in the upper quadrant of AI exposure, alongside Taiwan, South Korea, China and Vietnam.
Look at the size of India's blue bubble. It is one of the two largest on the entire map, matched only by Taiwan's. In other words, India's improved growth outlook is one of the major contributors to the IMF's greater optimism about the global economy.
India shares this part of the map with Taiwan and South Korea, but the nature of their economies is quite different. Taiwan and South Korea benefit from the AI boom primarily through exports of chips and other advanced hardware. The IMF cautions that this tailwind could weaken abruptly if investors conclude that expectations surrounding the AI boom have been overstated.
India's growth, by contrast, is underpinned, in the IMF's own words, by domestic demand and services.
That distinction is important. India's growth prospects are not dependent on the same drivers that propel the AI hardware exporters, even though India remains exposed to higher energy prices.
The point is y=that a country with a huge home market does not have to wait for foreign buyers to grow. its own people are the market. For India, this means that even when a war raises oil prices or a technology boom cools, the engine growth is still running at home.
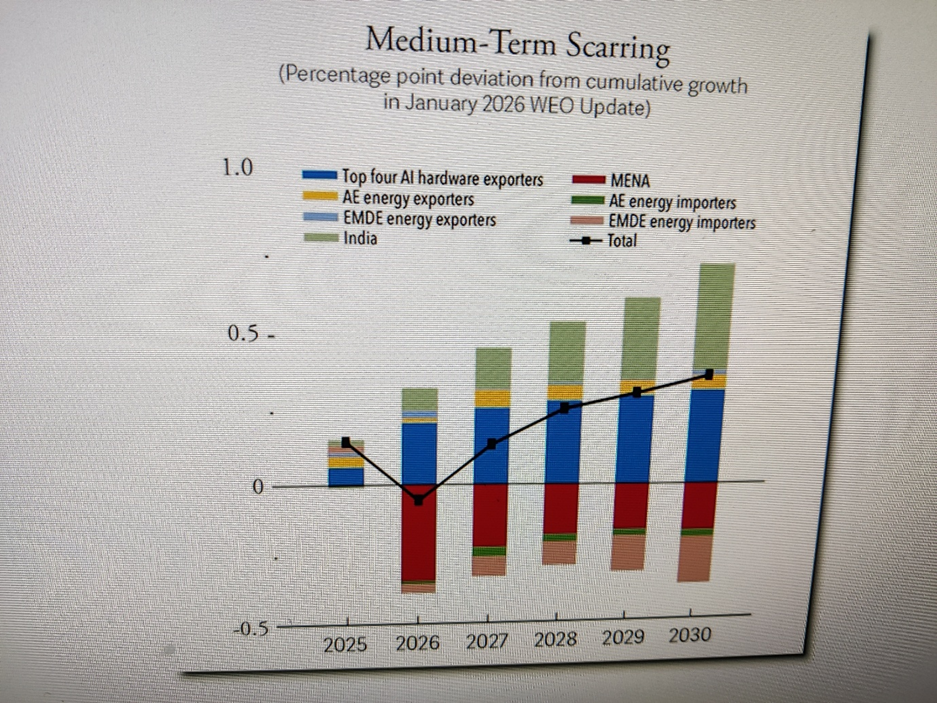
Understanding Figure 2: Looking Ahead to 2030
Figure 2 looks further ahead, to 2030, and shows how the IMF has revised its long-term growth forecasts since January. Bars above the zero line indicate that the IMF now expects stronger growth than it did in January, while bars below the line indicate downward revisions.
Each colour represents a group of countries. The red bars below the line represent the Middle East and North Africa, the region directly affected by the war. The pinkish bars, also showing downward revisions, represent developing countries that import energy. The dark blue bars represent four major AI hardware exporters: South Korea, Malaysia, Thailand and Taiwan.
Now look at the light green bar at the top. That represents India alone.There is something unusual here. The IMF has separated India from the broader group of energy-importing developing economies because its growth outlook is moving in a different direction from that of its peers.
The report explains that growth forecasts have been downgraded for energy importers, with India standing out through upward revisions. The IMF attributes this to favourable demographics, a large and expanding domestic market, and continued structural reforms.
Number that Deserves Closer Attention
Look at the bar for 2030. India's green bar is slightly larger than the combined blue bars for all four AI hardware exporters. It is also roughly equal in magnitude to the black line, which represents the net change in the world's long-term growth outlook after accounting for all upward and downward revisions.
Put simply, according to the IMF's own chart, the upward revision to India's growth outlook alone is roughly comparable to the net improvement in the long-term growth outlook for the entire world.
That is a striking observation. It suggests that India's contribution to the improved global growth outlook extends well beyond the immediate AI boom or the performance of energy-exporting economies. The IMF's assessment points instead to a combination of domestic demand, demographics, market expansion and structural reforms as important drivers of India's longer-term prospects.
Understanding Oil Shocks
Prices can rise for two very different reasons: people fear a future shortage, or the commodity is actually becoming scarce. To distinguish between the two, the IMF has developed a tool called the Commodity Price Tracker, which tracks these causes day by day.
The tracker shows that in January and February, before a single barrel of oil was lost, prices had already risen by about 10% on rumours of an attack alone. This was a price rise driven by fear rather than an actual loss of supply.
The IMF's key finding is that price increases caused by physical shortages tend to inflict greater economic damage and last longer than those driven by fear.
Why This Distinction Matters
When oil prices rise, central banks must decide whether to raise interest rates. The IMF report draws on the work of Michael Woodford, one of this year's Nobel laureates, to illustrate the difficult balance central banks face in such circumstances.
Raise rates too little, and inflation may become entrenched. Raise them too much, and the resulting monetary tightening could deepen the economic slowdown. Understanding whether a price spike reflects panic or a genuine shortage is therefore crucial to striking the right balance.
But we should not relax just yet.
The IMF warns that the world is drawing down its emergency oil stocks at a rate of about 2.7 million barrels a day. These reserves are approaching levels at which prices could jump suddenly rather than rise gradually.
Refined fuels, including diesel and petrol, remain 70–95% more expensive than before the war, as damage to refineries has removed about a fifth of the world's traded supply.
For a country like India, with its large agricultural sector, there is another important concern: the divergence in fertiliser prices. Phosphate fertilisers have risen by 22.4% since March, while nitrogen fertilisers have fallen by 31.5%, partly because China is exporting more.
These differences matter. Higher energy and phosphate fertiliser costs can put pressure on agricultural production and input costs, even as falling nitrogen fertiliser prices provide some relief.
The larger lesson is that market prices do not tell the whole story. We must understand whether they reflect fear, an actual supply disruption, or changing trade flows. The economic consequences—and the policy response required—can be very different.
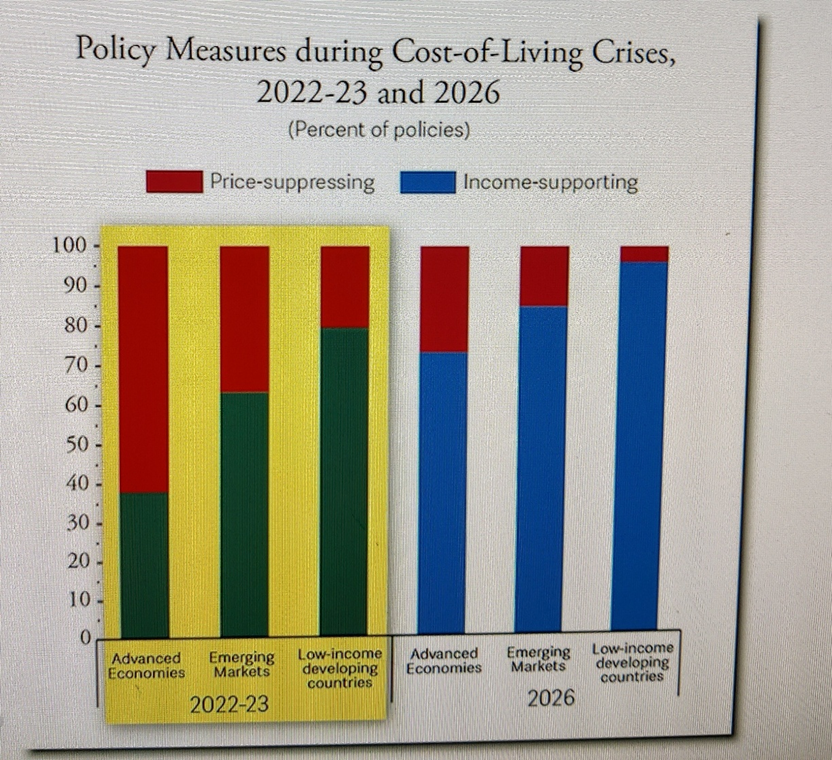
Figure 3: The Practical points
Figure 3 illustrates one of the most practical lessons in the report. When food and fuel suddenly become unaffordable, governments have two broad ways of helping people. They can hold prices down through subsidies, price caps or fuel tax cuts, or they can provide direct financial support to the households that need it most.
The IMF estimates that keeping prices artificially low can cost governments between three and 22 times as much as providing targeted cash support to protect poorer households to the same degree.
The reason is straightforward. A fuel subsidy benefits everyone, including the wealthy, whereas direct support can be directed towards those who need it most. Moreover, price controls can become counterproductive when several countries resort to them simultaneously, distorting markets and worsening supply pressures.
Each bar in the chart represents a category of government response. The three bars on the left cover the 2022–23 crisis, while the three on the right represent the current crisis.
One would expect the world to have learnt from the previous crisis. Has it? The chart suggests otherwise. In emerging economies, the blue share has increased from roughly three in every five measures to more than four in every five, indicating a greater reliance on measures that hold prices down rather than targeted support.
This is where India starts from a position of relative strength - for two important reasons.
The first is fiscal space. The IMF finds that, for most of the world's largest economies, stabilising government debt would require greater fiscal adjustment than currently planned. India is identified as an exception to this broad pattern.
The economist Evsey Domar explained the underlying principle in his 1944 work on public debt: the sustainability of government debt depends not simply on how much a country owes, but also on the growth of its economy relative to the cost of servicing that debt. The principle is intuitive. A home loan becomes easier to manage when a borrower's income rises steadily.
Protecting Vulnerable Households
An economy growing at around 7%, with its debt already on a relatively stable path, has a degree of fiscal flexibility that many other economies have lost. That does not mean India has unlimited room to spend, but it does give the government greater scope to respond to economic shocks.
The second advantage is having the right instrument.
India's Direct Benefit Transfer (DBT) system sends money directly into beneficiaries' bank accounts. This is precisely the kind of targeted support the IMF recommends. It gives India a mechanism to protect vulnerable households during the next price shock without incurring the enormous fiscal cost of blanket subsidies.
The Larger Message
The IMF's advice to countries rests on three broad pillars.
First, diversify energy sources through greater use of solar, wind and nuclear power. Second, diversify trade so that countries do not become excessively dependent on a handful of buyers or suppliers. Third, build buffers of fuel, food and other essential commodities so that the next shock can be met with adequate reserves rather than panic.
On trade, India is already making progress. The IMF itself identifies trade agreements involving India, the European Union and the United Kingdom as developments that could reduce trade barriers and support growth.
Maps are useful for classifying countries into neat categories. The IMF's map of an increasingly divided world does this reasonably well. Yet, on two important measures - government debt sustainability and long-term growth - the report identifies India as an exception to the broader pattern.
That is worth examining.
In a world where oil bought by Asian economies can suddenly trade at a discount or premium of $54 a barrel relative to oil bought by European economies, and where emergency reserves are being depleted, resilience matters as much as growth.
India cannot insulate itself completely from global shocks. As a major energy importer, it remains vulnerable to disruptions in oil supplies, rising fuel costs and higher fertiliser prices. But its domestic demand, growth prospects, fiscal position and capacity to deliver targeted support provide important buffers.
The larger message is that economic resilience is not merely about avoiding a crisis. It is about having the fiscal capacity, policy instruments and economic foundations to absorb a shock without allowing it to derail long-term growth.
The most valuable thing a country can have is not cheap oil or a cheap factory. It's the room to maneuver and India is one of the few large economies that still have it.
(The author is an Indian Army veteran and a contemporary affairs commentator ranging from geopolitics to technology to economy. The views expressed are personal. He can be reached at kl.viswanathan@gmail.com )







Post a Comment