Digitalisation as a policy priority: How South Asia compares with Southeast Asia
In South Asia, while digitalisation is of a high priority intervention, the other more basic issues such as enabling access to livelihood, health and education would need to be addressed and given a much higher priority so that inequalities in per capita consumption expenditure that prevail among households are addressed immediately, writes Partha Pratim Mitra for South Asia Monitor
 Jan 29, 2021

There is a view that If we are driven by the present crisis to aggressively digitize global trade and supply chains we can make the economic recovery stronger and more robust. In this connection a panel of experts recently explored the role of online platforms to bring about inclusive growth. There is a prevailing consensus that the presence of the digital economy improves productivity and competitiveness within and across regions.
It could also have substantial positive effects on macroeconomic performance as well as in enhancing regional and global economic integration and helping economies achieve the Sustainable Development Goals. At the same time, policymakers must exercise caution to consider digitalisation’s impact on international capital flows, trade, and the labor market. A recent Asian Development Bank Institute (ADBI)-Singapore Management University virtual conference featured new research on the role of digitalization in enhancing sustainable, inclusive, and balanced growth in Asia.
Signs of digital technology adoption are evident across Southeast Asia. In big cities, the use of mobile phones for messaging and social media has become ubiquitous. Ride-sharing services and delivery riders using apps to obtain their next booking are said to have changed the face of urban transport and other services. As consumers increasingly resort to online purchases of products, they are redrawing the future of brick-and-mortar retail businesses.
Digital trade, even in the pre-COVID-19 world, had been exploding across Asia with larger and larger numbers of firms and consumers involved in buying and selling digitally. By 2019, the size of the internet economy in Southeast Asia had hit $100 billion, tripling in size in just four years.
Digitalisation has also triggered entrepreneurial innovations. Analysis of more than 36,000 businesses in 17 Asian economies reveals that strong property rights and rule of law encourage entrepreneurs to formalize their businesses and that growth in formalized businesses is associated with greater innovation.
Rapid advances in Informational and Communications Technology (ICT) have revolutionized the entrepreneurial ecosystem. But can the illustrations from Southeast Asia about digitalisation be replicated in South Asia; if not what should be the policy priority is the question.
Let us examine what are the ground realities through different indicators. One such indicator is the Gini Index which measures the extent to which the distribution of income (or, in some cases, consumption expenditure) among individuals or households within an economy deviates from a perfectly equal distribution.
A Gini index of zero represents perfect equality and 100, perfect inequality. The Gini Index for some of the countries of Southeast Asia, China, and South Asia (see table 1) for the year 2014 which is the latest data available show that these societies do not portray an equitable income distribution and the pandemic in most countries is expected to worsen the situation further in terms of accessibility to digitisation.
Table 1: Gini Index in Southeast Asia, China and South Asia 2014
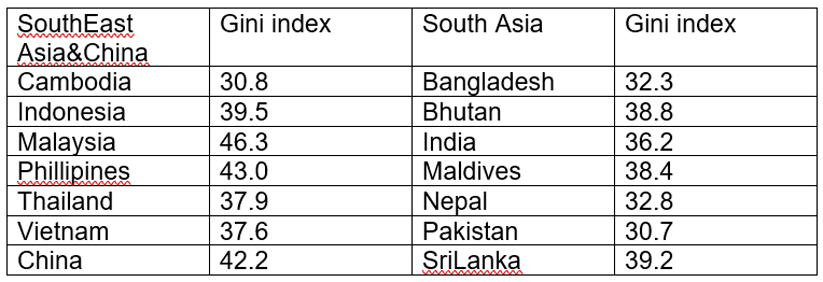
Source: ADB-Basic Statistics, 2017 https://www.adb.org/sites/default/files/publication/298061/basic-statistics-2017.pdf
The range (the difference between the maximum value and the minimum value) for inequality is larger in the countries of Southeast Asia and China as compared to South Asia. This trend shows the higher level of economic disparities that exist in the countries of Southeast Asia and China as compared to South Asia. Let us now turn to other parameters to see the spread of digital technology and a few socio-economic indicators in the two blocks of countries.
Table2: Proportion (%) of population covered by 3G mobile network
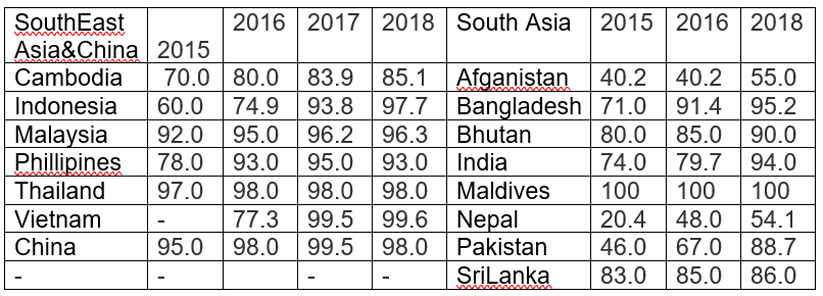
Source: ADB-Basic Statistics,(Various years),www.adb.org
It would be observed that the range for mobile network coverage (3G) has reduced within the region between 2015 and 2018 (Table2). The range within the countries of Southeast Asia including China in 2015 was 27 as compared to 62.6 within the countries of South Asia for that year. It reduced further in 2018 to 12.9 within the countries of Southeast Asia, including China, and 45.9 for South Asia. The trends show that the disparities in the spread of 3G mobile network were lesser within the countries of Southeast Asia including China as compared to South Asia. The trends also show that despite the disparities getting reduced much more in the South Asia region between 2015 and 2018, the spread of mobile networks has remained uneven in this region, thereby creating sharper inter-country disparities in the spread of the network within the South Asia region.
While the spread of the mobile network is an important factor for the process of digitalisation to become a successful tool to accelerate the development process, the status of nutrition, and ability to spend on citizens are much more fundamental areas for policy intervention during these difficult times.
Table 3; Nutritional status across regions
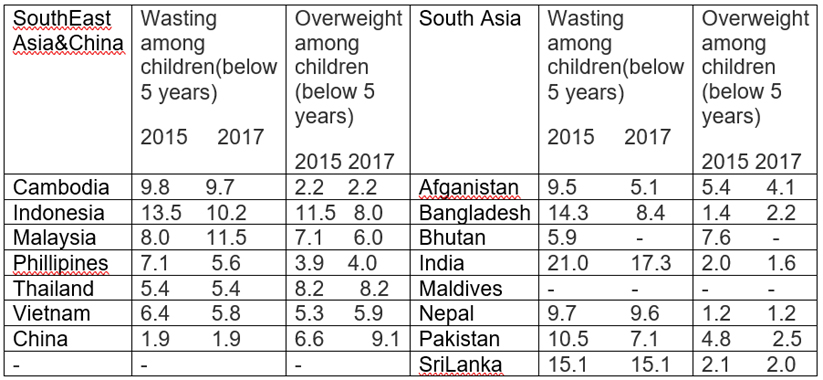
Source: ADB-Basic Statistics,(Various years), www.adb.org
The trends in wasting and overweight, both signs of severe malnutrition existing among children, show somewhat different trends (see table 2) while disparities between the countries within the region both in Southeast Asia including China have increased between 2015 and 2017 for wasting, they have gone down for overweight of children. The policy focus has therefore been more on wastage from the trends that are available. The focus of any nutrition intervention should be on reduction of wasting among children, which occurs primarily due to the quantity and quality of food access.
Let us now turn to the data on consumption expenditure patterns across income groups.
Table 4: Household expenditure per capita across countries
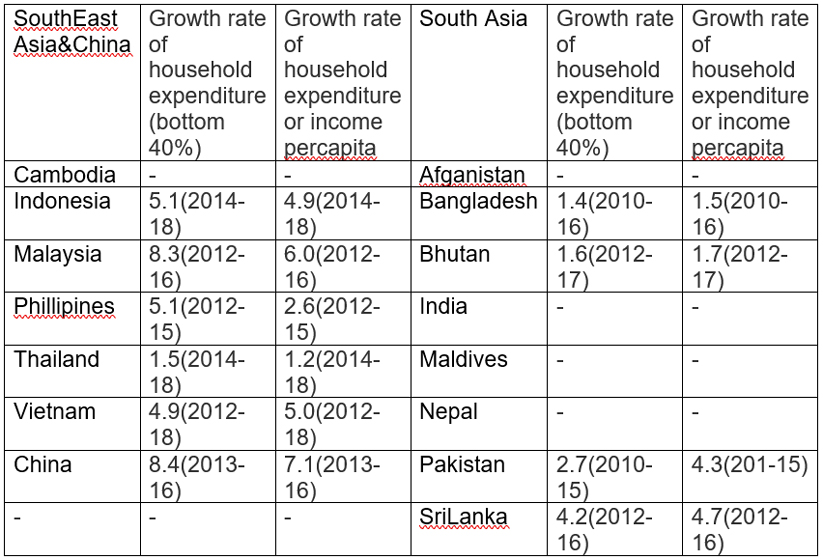
Source: ADB Basic Statistics,2020 www.adb.org
It is interesting to see that the growth of household expenditure maintains a uniform pattern for countries within the region but not across regions. Within Southeast Asia and China, the growth of household per capita expenditure has grown at a higher pace than per capita household expenditure for the entire economy in these countries.
It has been the other way round in the South Asia region with the growth of the bottom 40 percent of the households growing at a slower pace than for the entire economy of these countries (see table 4).The sources of growth of consumption demand is likely to be more uneven in South Asia as compared to Southeast Asia and China.
Economic revival, therefore, would become much more difficult during the pandemic when it is expected that the lower-income households would get more affected. The policy priority, fiscal or in terms of ensuring supplies of food and other essentials will have to be on the bottom 40 percent of the households.
We would now look at certain core economic indicators to see if there were any differences in the trends observed in them for the two regions.
Table 5: Gross domestic investment and fiscal balances in Southeast Asia and South Asia
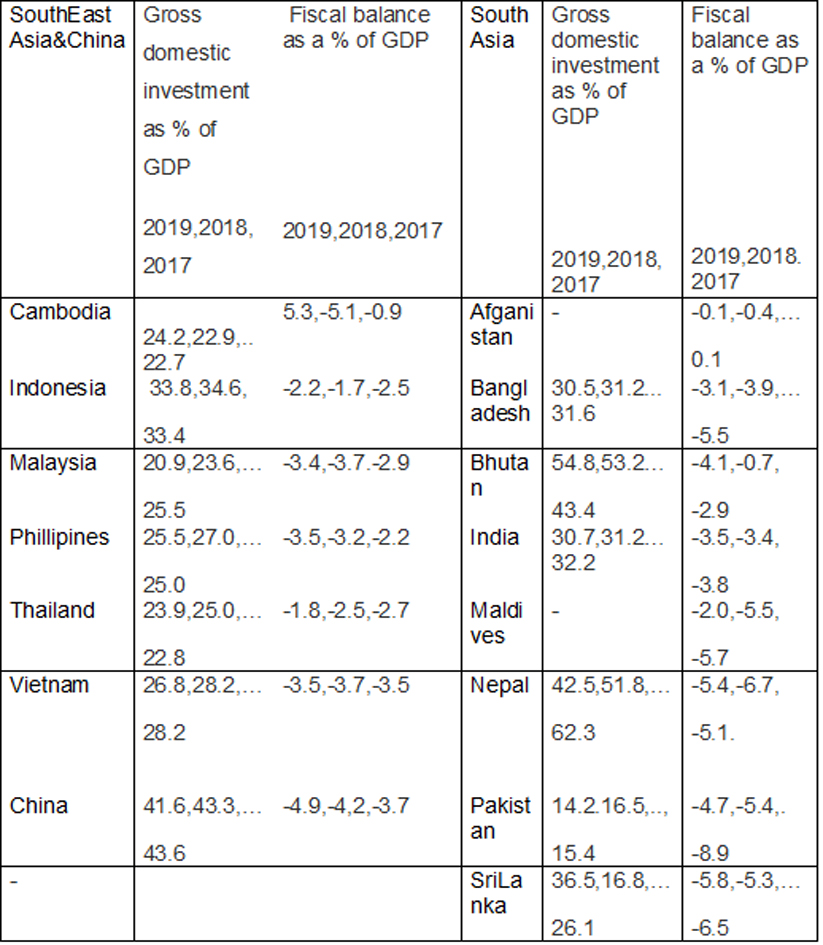
Source: ADB Basic Statistics,(various years) www.adb.org
The trends between 2017 and 2019 for the two regions show that although there has been a general decline in the gross domestic investment as the proportion of GDP in most countries in the two regions, the decline has been sharper in some of the countries in the South Asia region. The fiscal balances have however been marginally higher for most countries in the South Asian region as compared to Southeast Asia (see table 5). But we shall see how some other core economic indicators have emerged in the two regions before the pandemic in 2019.
Table 6: Other core indicators for Southeast Asia and South Asia
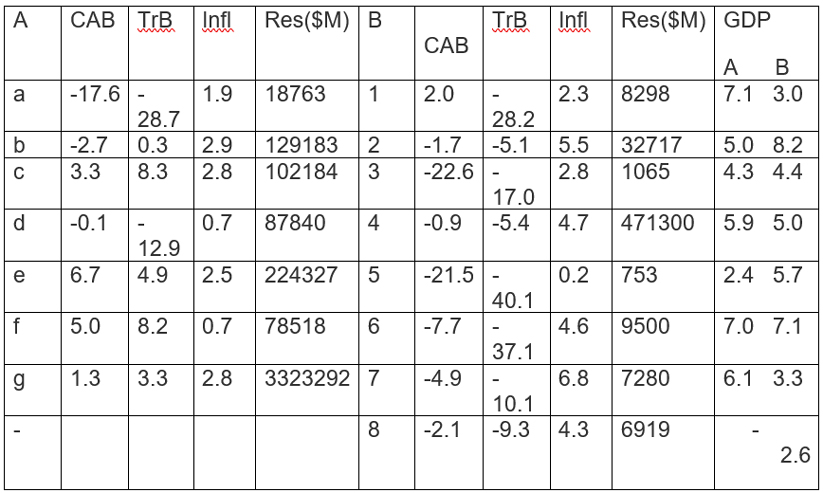
Source: ADB Basic Statistics (various years) www.adb.org
The data on core indicators (see table 6) show that South Asia while having registered in 2019 an average growth rate of 4.6 percent as compared to 5.4 percent in Southeast Asia including China has other core indicators. Current account balance, trade balance, inflation, and foreign exchange reserves – not as favourable as Southeast Asia including China. Hence policy priorities in the wake of the pandemic will have to be different and based on the local ground realities.
In South Asia, while digitalisation is of a high priority intervention, the other more basic issues such as enabling access to livelihood, health and education would need to be addressed and given a much higher priority so that inequalities in per capita consumption expenditure that prevail among households are addressed immediately. Such measures call for more human-centric approach with people as the policy priority for intervention.
Pure techno-centric measures such as digitalisation are necessary but certainly not sufficient under unprecedented adverse health and economic conditions that we presently see in the South Asian region.
(The writer is a retired Indian Economic Service officer who worked in the labour ministry. The views expressed are personal. He can be contacted at ppmitra56@gmail.com)
References:
By Steven Beck The global economy will emerge stronger if COVID-19 drives digitization (adb.org)May 15,2020
Online Platforms to Catalyze Inclusive Growth
Video | 13 January 2021
https://www.adb.org/news/videos/online-platforms-catalyze-inclusive-growth-0
Virtual Conference on Digitalization and Sustainable Economic Development
Event | 8 - 10 December
2020 https://www.adb.org/news/events/digitalization-and-sustainable-economic-development#accordion-0-2
“World Bank. 2019. The Digital Economy in Southeast Asia : Strengthening the Foundations for Future Growth. World Bank, Washington, DC. © World Bank. https://openknowledge.worldbank.org/handle/10986/31803 License: CC BY 3.0 IGO.”
Advancing Digital Trade in Asia COMMUNITY PAPER OCTOBER,World Economic Forum 2020 http://www3.weforum.org/docs/WEF_GFC_Advancing_Digital_Trade_in_Asia_2020.pdf
ASIAN DEVELOPMENT OUTLOOK 2020 WHAT DRIVES INNOVATION IN ASIA? P19-20 APRIL 2020ASIAN DEVELOPMENT BANK https://www.adb.org/sites/default/files/publication/575626/ado2020.pdf
For a formal definition of the Gini index and examples, see
http://www.leftbusinessobserver.com/Gini_supplement.html. https://stats.oecd.org/glossary/detail.asp?ID=4842


Post a Comment