South Asia: Structural transformation, trade openness and self-sufficiency
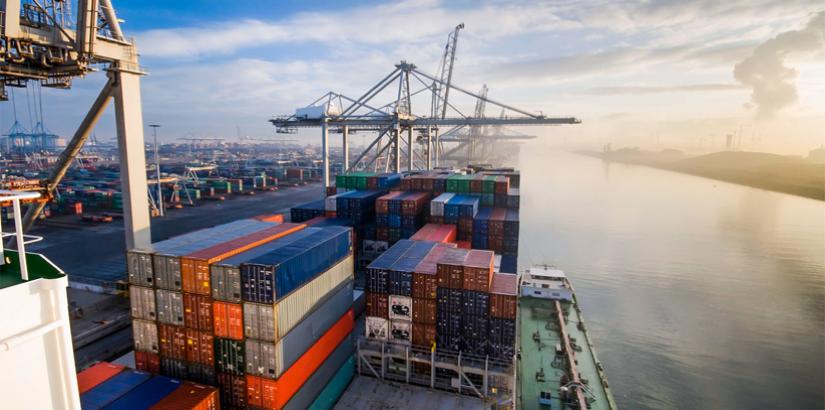
The region’s dependence on imports for production, as well as the contributions of its exports through value chains place some of its economies in an influential position within the global production and trading network, writes Partha Pratim Mitra for South Asia Monitor
 Dec 24, 2020
In the last two decades, world trade gradually came to be defined by the extent to which such trade was an integral part of a framework that made countries interdependent on each other.
Automation and developments in transport, information, and communications technologies enabled firms to fragment and distribute their production processes across the globe to become efficient in the global economic network.
Global business chains
Participation in global business chains became a more viable path toward economic transformation, especially for developing economies. Trade in the services and inputs became as important as a traditional trade in the finished goods and its measurement was seen as critical to the assessment of economic performance and policy formulation.
Following more than a decade of generally uninterrupted growth, a series of economic crises, particularly the global financial crisis of 2008-9 created new challenges for the increasingly interconnected and interdependent economies. More recently, trade tensions between major trading nations such as the US and China have affected production in major regional hubs, while the COVID-19 pandemic continues to adversely impact consumption patterns, production, and global businesses in every economy.
In a short span of time, the centrality of world trade has shifted from mere participation in global business or value chains to a more fundamental one which is to ensure the very stability and resilience of the global economy, given the increasing importance of global business chain participation in world trade
In order to explore the impact of foreign trade on domestic economies, data published in The Asian Development Bank’s Multi-Regional Input-Output Tables (MRIOTs) provides useful analytical insights into today’s increasingly globalized economic environment. The data and analyses of MRIOTs also, consist of 25 economies in Asia and the Pacific region for the period 2000 and 2018. The ADB Classification of the 25 countries include South and Central Asia (nine countries) - Bangladesh, Bhutan, India, Kazakhstan, Kyrgyz Republic, Maldives, Nepal, Pakistan, and Sri Lanka. Southeast Asia and the Pacific (10 countries) Brunei Darussalam, Cambodia, Fiji, Indonesia, the Lao People’s Democratic Republic, Malaysia, the Philippines, Singapore, Thailand, and Vietnam. East Asia(six countries) - People’s Republic of China, Hong Kong, Japan, Mongolia, the Republic of Korea, and Taipei China.
The data shows that in 2000, private consumption accounted for an average of 47.6 percent of the total final demand of the 25 economies; gross capital formation - 22.9 percent; exports- 17.6 percent; and government consumption-12.8 percent. Private consumption had the largest share in the total final demand of most economies, ranging from 35.6 percent to 66.5 percent.
Pakistan, Bangladesh, and Nepal had high shares, with 60 percent of total final demand accounted for by private consumption. On the other hand, the final demand of the Maldives was created from exports rather than domestic consumption. Compared to 2000, the composition of final demand in 2018 changed and was less concentrated in private consumption and more towards exports. In addition to the Maldives, Singapore, and Malaysia, the total final demands of other economies such as Vietnam, Brunei Darussalam was more export-dominated than others. The total final demand for the rest of the 25 economies remained largely driven by private consumption, with shares ranging from 32.9 percent to 68.3 percent.
The total final demand consists of –
(A)household final consumption demand,
(B) final consumption demand of non-profit institutions serving households (NPISHs)
(C) government final consumption demand
(D)gross fixed capital formation,
(E)changes in inventories and
(F)exports of the country
In the total final demand, (A) and (B) refer to private domestic consumption demand, (C) refers to the government’s own consumption demands which add to the total domestic demand of the economy, (D) refers to investment demand which also adds to domestic demand for goods and services in the economy, (E) refers to changes in inventories of goods from one period to another which has an impact on the domestic demand and (F)refers to exports that generate income from overseas but create domestic demand in the economy when that overseas income is spent in the domestic economy, thereby adding to the final demand in the country.
With changes in final consumption demand across the 25 countries, changes in the trends in structural transformation have also occurred. These changes show that the business services sector had the highest share in gross value-added (GVA is the difference between the gross output and intermediate inputs or consumption of a given sector) 37.6 percent in 2000 and 45.8 percent in 2018. In absolute terms, business services in East Asia had the highest value-added among all the sub regional groups for both years, even though the sector’s share within the sub-region decreased from 43.9 percent in 2000 to 39.7 percent in 2018.
Meanwhile, the shares of business services sectors in the respective GVAs of South and Central Asia, Southeast Asia and the Pacific, and East Asia increased significantly from 2000 to about 40.0 percent in 2018. (Business services sector refers to the sale, maintenance, and repair of motor vehicles and motorcycles; retail sale of fuel. Wholesale trade and commission trade except for motor vehicles and motorcycles. Retail trade refers to repair of household goods, hotels, and restaurants, inland transport, water transport, air transport, and other supporting and auxiliary transport activities like activities of travel agencies, post, and telecommunications, financial intermediation, real estate activities, renting of machinery and equipment; and other business activities).
The pattern of structural transformation observed in most countries of the Asia and Pacific region – whereby agriculture’s share of output and employment initially declines as the manufacturing industry’s share grows, followed in the second stage by a decline in the share of manufacturing as services become more dominant is similar to the experience of developed economies
Trade in the Asia and Pacific region
Total trade in the Asia and Pacific region has grown significantly from 2000 levels. From 2000 to 2018, the region’s exports grew at an annual average rate of 6.3 percent, while imports increased at an annual average rate of 6.9 percent. The region’s exports were primarily composed of economic contributions from domestic sectors, accounting for an average of 73 percent of total exports from 2000 to 2018. These ratios show the consistently strong involvement of domestic sectors in export production, as well as the increasing role of imports in production.
The region’s dependence on imports for production, as well as the contributions of its exports through value chains place some of its economies in an influential position within the global production and trading network. On average, international trade activity in 2018 was 85 percent of the gross domestic product in the region. This openness to trade, however, differed widely across individual economies.
In this broader context of trade in the 25 nations in the Asia-Pacific region in our analytical framework, we have seen that the trade openness and self-sufficiency ratio of some of the countries of South Asia. Trade openness is calculated as the ratio of total exports and imports to the total gross domestic product in the economy. It is an indicator of the importance of international trade as an economic activity in that country. For most countries in the South Asian region, the trade openness ratio has shown a decline as compared to their 10 years mean and the lower rankings among the group of 25 countries in trade openness. (See Table 1).
The self-sufficiency ratio helps us to understand the extent to which the country is able to meet its domestic demand through its own production. If the domestic output exceeds the local demand in the economy, then the sector is self -sufficient.
The domestic output–domestic demand ratio, however, does not always provide a complete picture of an economy’s self-sufficiency. Though a high ratio value implies that a particular economy’s production is enough to cover the value of its demand but as economies specialize in certain types of production, the variety of products demanded in the local economy may not be satisfied by what is available locally and hence they resort to imports from what they earn either locally or through exports. In South Asia, many countries have a lower ranking in the self-sufficiency ratio among the group of 25 countries.
Smaller countries such as Nepal, Bhutan, and the Maldives which have a relatively higher rank in trade openness as compared to other countries in South Asia, makes it possible for them to source many of their products from outside through their export earnings (See table 1).
Table 1: Trade openness and self- sufficiency ratio of South Asian countries
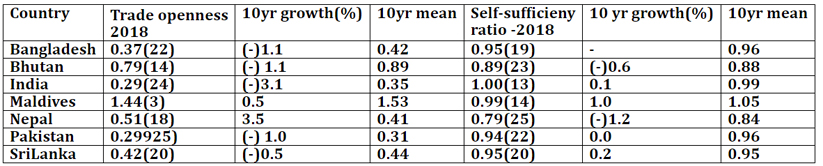
Note: figures in brackets show the rank of the country among the 25 countries of the Asia and Pacific region.
Source: Economic Indicators for South and Central Asia: Input-Output Tables, December 2020https://www.adb.org/sites/default/files/publication/663161/ei-south-central-asia-input-output-tables-2020.pdf
Table 2:Export-output ratios of South Asian countries
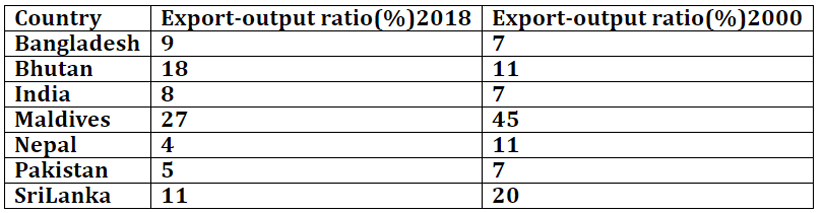
Source: Economic Indicators for South and Central Asia: Input-Output Tables, December 2020https://www.adb.org/sites/default/files/publication/663161/ei-south-central-asia-input-output-tables-2020.pd
The low export to output ratio is a feature of the South Asian region with the exception of the Maldives and Bhutan. (See table 2). The Maldives has to rely on tourism and fisheries for foreign exchange earnings to meet its other sectoral demands.
The impact of globalisation presently is being reassessed due to the interdependency that it has created among the different regions. The experience of some of the Southeast Asian and East Asian countries has shown that globalisation has given them a way forward to not only strengthen their interdependence on each other but also create domestic health management systems to beat theCOVID-19 pandemic and countries of South Asia have a lot to learn from the global experience.
(The writer is a retired Indian Economic Service officer who worked in the labour ministry. The views expressed are personal. He can be contacted at ppmitra56@gmail.com)
References:
Yasuyuki Sawada Chief Economist and Director General Economic Research and Regional Cooperation Department Asian Development Bank Foreword to Economic Indicators for South and Central Asia: Input-Output Tables, December 2020https://www.adb.org/sites/default/files/publication/663161/ei-south-central-asia-input-output-tables-2020.pdf
ECONOMIC INDICATORS FOR SOUTH AND CENTRAL ASIA INPUT–OUTPUT TABLES,DECEMBER 2020,Asian Development Bank,Manila https://www.adb.org/sites/default/files/publication/663161/ei-south-central-asia-input-output-tables-2020.pdf
Ibid,p5
Ibid,p7
Ibid,p10
Ibid,P37
Ibid,p40


Post a Comment